
The global advanced visualization market size is projected to be USD 2,824.5 million in 2021 and is expected to witness a CAGR of 11.9% during the forecast period. Developments in AV software such as incorporation of PACS & AV tools is a key driver for the growth of the global advanced visualization market. Additionally, technical advancements in the field of AV technology leading to enhanced data interpretation and growth in target diseases globally along with growing geriatric population are some of the other drivers propelling the market growth. Nevertheless, limited accessibility of repayments for radiology-based diagnostic procedures and technological restrictions connected with existing AV analysis are expected to restrain the global market growth.
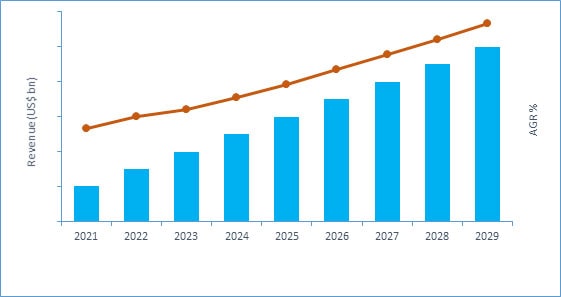
Source: Erevna Healthcare
By Product & Service
Based on product & service, the market is segmented into services and hardware & software. In 2021, the hardware & software segment accounted for a substantial revenue share and is expected to grow with a lucrative CAGR during the forecast period. This is attributed to the growth of technologically advanced software, rise in adoption of advanced visualization solutions in diagnostic centers and hospitals worldwide. Services segment is expected to grow at a profitable CAGR during the forecast period. This is attributed to the rising penetration of healthcare IT and increasing need to allow immediate access to all related patients data.
By Solution Type
Solution type segment is sub segmented into standalone workstation-based solutions and enterprise-wide thin client-based solutions. In 2021, the standalone workstation-based solutions segment accounted for a substantial revenue share and is anticipated to grow with a lucrative CAGR during the forecast period. This is attributed to various advantages such as improved data storage capacity and data relocation capabilities worldwide. Enterprise-wide thin client-based solutions segment is projected to grow at a profitable CAGR during the forecast period. This is attributed to the increasing application of this segment as it offers efficient analysis, multi-user interface, and central post-processing solutions.
By Imaging Modality
Based on application, the market is categorized into ultrasound, Magnetic Resonance Imaging (MRI), radiotherapy (RT), Computed Tomography (CT), Positron Emission Tomography (PET), nuclear medicine, and other imaging modalities. In 2021, the magnetic resonance imaging (MRI) segment accounted for a substantial revenue share with lucrative CAGR during the forecast period. This is due to the growth in usage of MRI in several clinical areas such as cardiology, radiology, and oncology and worldwide. The Computed Tomography (CT) segment is anticipated to grow at a profitable CAGR during the forecast period due to the shift of health care infrastructure towards image-guided technologies.
By Clinical Application
Based on clinical application, the market is categorized into orthopedics, radiology/interventional radiology, cardiology, vascular, oncology, neurology, and other clinical applications. In 2021, the radiology/interventional radiology segment accounted for a substantial revenue share and is expected to grow with a lucrative CAGR during the forecast period. This is due to the high rate of adoption for centralized server-based advanced visualization software worldwide. The cardiology segment is anticipated to grow at a profitable CAGR during the forecast period due to the benefit of conducting wide-ranging number of tests that can be conducted by using advanced visualizations along with increase in heart related ailments.
Regional Insights
In 2021, North America accounted for the maximum revenue share in the global market and is anticipated to maintain its dominance during the forecast period. This is attributed to the presence of major players in the region, increase in the share of healthcare expenditure in the per capita income, growth in initiatives from the government, accessibility of technological advanced products, and growth in aged population across many countries in the region. Asia Pacific market is expected to grow at the fastest CAGR over the forecast period owing to less stringent regulations, growing government and corporate investment in the healthcare sector, increasing demand for advanced medication and treatment, and availability of skilled labor forces at economic costs, are the major factors in this region.
Competitor Insights
Some of the key players in the advanced visualization market are General Electric Company (U.S.); Siemens AG (Germany); Koninklijke Philips N.V. (Netherlands); Toshiba Corporation (Japan); Terarecon, Inc. (U.S.); Fujifilm Holdings Ltd. (Japan); Agfa HealthCare NV (Belgium); Carestream Health, Inc. (U.S.); Qi Imaging (U.S.); and Visage Imaging, Inc. (U.S.). The leading players operating in the advanced visualization industry are adopting various strategies including R&D investments, adaption of advanced techniques, new technology launches, mergers & acquisitions, and regional expansions to capture a maximum revenue share.
This exhaustive research report focuses on market size and forecast at global, segmental, regional and country level along with key market trends and dynamics from 2021 to 2029. The advanced visualization market report is categorized into the following segments and subsegments:
Advanced Visualization Market, By Product & Service (Revenue, USD Million, 2021 – 2029)
- Services
- Implementation Services
- Post-Sale and Maintenance Services
- Consulting/Optimization Services
- Training and Education Services
- Hardware & Software
Advanced Visualization Market, By Solution Type (Revenue, USD Million, 2021 – 2029)
- Standalone Workstation-Based Solutions
- Enterprise-Wide Thin Client-Based Solutions
Advanced Visualization Market, By Imaging Modality (Revenue, USD Million, 2021 – 2029)
- Ultrasound
- Magnetic Resonance Imaging (MRI)
- Radiotherapy (RT)
- Computed Tomography (CT)
- Positron Emission Tomography (PET)
- Nuclear Medicine
- Other Imaging Modalities
Advanced Visualization Market, By Clinical Application (Revenue, USD Million, 2021 – 2029)
- Orthopedics
- Radiology/Interventional Radiology
- Cardiology
- Vascular
- Oncology
- Neurology
- Other Clinical Applications
Advanced Visualization Market, By Region (Revenue, USD Million, 2021 – 2029)
- North America
- U.S.
- Canada
- Europe
- Germany
- France
- UK
- Spain
- Italy
- Russia
- Rest of Europe
- Asia Pacific
- China
- Japan
- India
- Australia
- South Korea
- Rest of APAC
- Latin America
- Brazil
- Mexico
- Argentina
- Rest of LATAM
- Middle East & Africa
- South Africa
- Saudi Arabia
- Rest of MEA
Scope of Advanced Visualization Market Report:
| Key Parameters | Details |
|---|---|
| Base Year |
|
| Forecast Period |
|
| Study Coverage |
|
| Qualitative Analysis |
|
| Regional Market Scope |
|
| Company Profiles |
|
| 15% Free Customization Available |
|
Table of Contents: Advanced Visualization Market 2021-2029
- Research Methodology
- Study Objectives
- Study Scope
- Research Assumptions
- Research Framework
- Research Models
- Bottom-up Approach
- Top-down Approach
- Data Triangulation
- Data Procurement
- Internal Database
- Secondary Research
- Purchased Database
- Primary Research
- Data Analysis
- Data Validation
- Market Size Estimation
- Market Forecast Model
- Quality Assessment
- Research Models
- Introduction: Advanced Visualization
- Executive Summary
- Global Market Scenario
- Segment Market Scenario
- Geographic Market Scenario
- COVID-19 Impact
- Competitive Landscape
- Market Dynamics
- Market Drivers
- Driver 1
- Driver 2
- Driver 3
- Driver 4
- Driver 5
- Market Restraint
- Restraint 1
- Restraint 2
- Restraint 3
- Restraint 4
- Market Opportunities
- Opportunity 1
- Opportunity 2
- Opportunity 3
- Opportunity 4
- Market Trends
- Trend 1
- Trend 2
- Trend 3
- Trend 4
- Market Challenges
- Challenge 1
- Challenge 2
- Challenge 3
- Challenge 4
- Market Drivers
- Market Environment Analysis
- Porter’s 5 Forces Analysis
- PESTEL Analysis
- Value Chain Analysis
- SWOT Analysis
- Benchmark
- COVID-19 Impact Analysis: Advanced Visualization Market
- COVID-19: Overview
- COVID-19 Impact on the Global Market
- COVID-19 Impact on the Regional Markets
- Market Analysis by Product & Services
- Services
- Services Market Forecast, 2021-2029 (USD Million)
- Hardware & Software
- Hardware & Software Market Forecast, 2021-2029 (USD Million)
- Services
- Market Analysis by Solution Type
- Standalone Workstation-Based Solutions
- Standalone Workstation-Based Solutions Market Forecast, 2021-2029 (USD Million)
- Enterprise-Wide Thin Client-Based Solutions
- Enterprise-Wide Thin Client-Based Solutions Market Forecast, 2021-2029 (USD Million)
- Standalone Workstation-Based Solutions
- Market Analysis by Modality
- Ultrasound
- Ultrasound Market Forecast, 2021-2029 (USD Million)
- Magnetic Resonance Imaging (MRI)
- Magnetic Resonance Imaging (MRI) Market Forecast, 2021-2029 (USD Million)
- Radiotherapy (RT)
- Radiotherapy (RT) Market Forecast, 2021-2029 (USD Million)
- Computed Tomography (CT)
- Computed Tomography (CT) Market Forecast, 2021-2029 (USD Million)
- Positron Emission Tomography (PET)
- Positron Emission Tomography (PET) Market Forecast, 2021-2029 (USD Million)
- Nuclear Medicine
- Nuclear Medicine Market Forecast, 2021-2029 (USD Million)
- Other Imaging Modalities
- Other Imaging Modalities Market Forecast, 2021-2029 (USD Million)
- Ultrasound
- Market Analysis by Clinical Application
- Orthopedics
- Orthopedics Market Forecast, 2021-2029 (USD Million)
- Radiology/Interventional Radiology
- Radiology/Interventional Radiology Market Forecast, 2021-2029 (USD Million)
- Cardiology
- Cardiology Market Forecast, 2021-2029 (USD Million)
- Vascular
- Vascular Market Forecast, 2021-2029 (USD Million)
- Oncology
- Oncology Market Forecast, 2021-2029 (USD Million)
- Neurology
- Neurology Market Forecast, 2021-2029 (USD Million)
- Others
- Others Market Forecast, 2021-2029 (USD Million)
- Orthopedics
- Regional Market Analysis
- Regional Market Trends
- Regional Market: Comparative Analysis
- North America Advanced Visualization Market
- North America Advanced Visualization Market
- North America Market Size and Forecast, 2021-2029 (USD Million)
- Market Size and Forecast by Product & Services, 2021-2029 (USD Million)
- Market Size and Forecast by Solution Type, 2021-2029 (USD Million)
- Market Size and Forecast by Modality, 2021-2029 (USD Million)
- Market Size and Forecast by Clinical Application, 2021-2029 (USD Million)
- S. Advanced Visualization Market
- S. Market Size and Forecast, 2021-2029 (USD Million)
- Market Size and Forecast by Product & Services, 2021-2029 (USD Million)
- Market Size and Forecast by Solution Type, 2021-2029 (USD Million)
- Market Size and Forecast by Modality, 2021-2029 (USD Million)
- Market Size and Forecast by Clinical Application, 2021-2029 (USD Million)
- Canada Advanced Visualization Market
- Canada Market Size and Forecast, 2021-2029 (USD Million)
- Market Size and Forecast by Product & Services, 2021-2029 (USD Million)
- Market Size and Forecast by Solution Type, 2021-2029 (USD Million)
- Market Size and Forecast by Modality, 2021-2029 (USD Million)
- Market Size and Forecast by Clinical Application, 2021-2029 (USD Million)
- Canada Market Size and Forecast, 2021-2029 (USD Million)
- S. Market Size and Forecast, 2021-2029 (USD Million)
- North America Market Size and Forecast, 2021-2029 (USD Million)
- North America Advanced Visualization Market
- Europe Advanced Visualization Market
- Europe Advanced Visualization Market
- Europe Market Size and Forecast, 2021-2029 (USD Million)
- Market Size and Forecast by Product & Services, 2021-2029 (USD Million)
- Market Size and Forecast by Solution Type, 2021-2029 (USD Million)
- Market Size and Forecast by Modality, 2021-2029 (USD Million)
- Market Size and Forecast by Clinical Application, 2021-2029 (USD Million)
- Germany Advanced Visualization Market
- Germany Market Size and Forecast, 2021-2029 (USD Million)
- Market Size and Forecast by Product & Services, 2021-2029 (USD Million)
- Market Size and Forecast by Solution Type, 2021-2029 (USD Million)
- Market Size and Forecast by Modality, 2021-2029 (USD Million)
- Market Size and Forecast by Clinical Application, 2021-2029 (USD Million)
- UK Advanced Visualization Market
- UK Market Size and Forecast, 2021-2029 (USD Million)
- Market Size and Forecast by Product & Services, 2021-2029 (USD Million)
- Market Size and Forecast by Solution Type, 2021-2029 (USD Million)
- Market Size and Forecast by Modality, 2021-2029 (USD Million)
- Market Size and Forecast by Clinical Application, 2021-2029 (USD Million)
- France Advanced Visualization Market
- France Market Size and Forecast, 2021-2029 (USD Million)
- Market Size and Forecast by Product & Services, 2021-2029 (USD Million)
- Market Size and Forecast by Solution Type, 2021-2029 (USD Million)
- Market Size and Forecast by Modality, 2021-2029 (USD Million)
- Market Size and Forecast by Clinical Application, 2021-2029 (USD Million)
- Spain Advanced Visualization Market
- Spain Market Size and Forecast, 2021-2029 (USD Million)
- Market Size and Forecast by Product & Services, 2021-2029 (USD Million)
- Market Size and Forecast by Solution Type, 2021-2029 (USD Million)
- Market Size and Forecast by Modality, 2021-2029 (USD Million)
- Market Size and Forecast by Clinical Application, 2021-2029 (USD Million)
- Italy Advanced Visualization Market
- Italy Market Size and Forecast, 2021-2029 (USD Million)
- Market Size and Forecast by Product & Services, 2021-2029 (USD Million)
- Market Size and Forecast by Solution Type, 2021-2029 (USD Million)
- Market Size and Forecast by Modality, 2021-2029 (USD Million)
- Market Size and Forecast by Clinical Application, 2021-2029 (USD Million)
- Rest of EuropeAdvanced Visualization Market
- Rest of Europe Market Size and Forecast, 2021-2029 (USD Million)
- Market Size and Forecast by Product & Services, 2021-2029 (USD Million)
- Market Size and Forecast by Solution Type, 2021-2029 (USD Million)
- Market Size and Forecast by Modality, 2021-2029 (USD Million)
- Market Size and Forecast by Clinical Application, 2021-2029 (USD Million)
- Rest of Europe Market Size and Forecast, 2021-2029 (USD Million)
- Italy Market Size and Forecast, 2021-2029 (USD Million)
- Spain Market Size and Forecast, 2021-2029 (USD Million)
- France Market Size and Forecast, 2021-2029 (USD Million)
- UK Market Size and Forecast, 2021-2029 (USD Million)
- Germany Market Size and Forecast, 2021-2029 (USD Million)
- Europe Market Size and Forecast, 2021-2029 (USD Million)
- Europe Advanced Visualization Market
- Asia PacificAdvanced Visualization Market
- Asia PacificAdvanced Visualization Market
- Asia Pacific Market Size and Forecast, 2021-2029 (USD Million)
- Market Size and Forecast by Product & Services, 2021-2029 (USD Million)
- Market Size and Forecast by Solution Type, 2021-2029 (USD Million)
- Market Size and Forecast by Modality, 2021-2029 (USD Million)
- Market Size and Forecast by Clinical Application, 2021-2029 (USD Million)
- Japan Advanced Visualization Market
- Japan Market Size and Forecast, 2021-2029 (USD Million)
- Market Size and Forecast by Product & Services, 2021-2029 (USD Million)
- Market Size and Forecast by Solution Type, 2021-2029 (USD Million)
- Market Size and Forecast by Modality, 2021-2029 (USD Million)
- Market Size and Forecast by Clinical Application, 2021-2029 (USD Million)
- China Advanced Visualization Market
- China Market Size and Forecast, 2021-2029 (USD Million)
- Market Size and Forecast by Product & Services, 2021-2029 (USD Million)
- Market Size and Forecast by Solution Type, 2021-2029 (USD Million)
- Market Size and Forecast by Modality, 2021-2029 (USD Million)
- Market Size and Forecast by Clinical Application, 2021-2029 (USD Million)
- India Advanced Visualization Market
- India Market Size and Forecast, 2021-2029 (USD Million)
- Market Size and Forecast by Product & Services, 2021-2029 (USD Million)
- Market Size and Forecast by Solution Type, 2021-2029 (USD Million)
- Market Size and Forecast by Modality, 2021-2029 (USD Million)
- Market Size and Forecast by Clinical Application, 2021-2029 (USD Million)
- South Korea Advanced Visualization Market
- South Korea Market Size and Forecast, 2021-2029 (USD Million)
- Market Size and Forecast by Product & Services, 2021-2029 (USD Million)
- Market Size and Forecast by Solution Type, 2021-2029 (USD Million)
- Market Size and Forecast by Modality, 2021-2029 (USD Million)
- Market Size and Forecast by Clinical Application, 2021-2029 (USD Million)
- Australia Advanced Visualization Market
- Australia Market Size and Forecast, 2021-2029 (USD Million)
- Market Size and Forecast by Product & Services, 2021-2029 (USD Million)
- Market Size and Forecast by Solution Type, 2021-2029 (USD Million)
- Market Size and Forecast by Modality 2021-2029 (USD Million)
- Market Size and Forecast by Clinical Application, 2021-2029 (USD Million)
- Rest of Asia Pacific Advanced Visualization Market
- Rest of Asia Pacific Market Size and Forecast, 2021-2029 (USD Million)
- Market Size and Forecast by Product & Services, 2021-2029 (USD Million)
- Market Size and Forecast by Solution Type, 2021-2029 (USD Million)
- Market Size and Forecast by Modality, 2021-2029 (USD Million)
- Market Size and Forecast by Clinical Application, 2021-2029 (USD Million)
- Rest of Asia Pacific Market Size and Forecast, 2021-2029 (USD Million)
- Australia Market Size and Forecast, 2021-2029 (USD Million)
- South Korea Market Size and Forecast, 2021-2029 (USD Million)
- India Market Size and Forecast, 2021-2029 (USD Million)
- China Market Size and Forecast, 2021-2029 (USD Million)
- Japan Market Size and Forecast, 2021-2029 (USD Million)
- Asia Pacific Market Size and Forecast, 2021-2029 (USD Million)
- Asia PacificAdvanced Visualization Market
- Latin America Advanced Visualization Market
- Latin America Advanced Visualization Market
- Latin America Market Size and Forecast, 2021-2029 (USD Million)
- Market Size and Forecast by Product & Services, 2021-2029 (USD Million)
- Market Size and Forecast by Solution Type, 2021-2029 (USD Million)
- Market Size and Forecast by Modality, 2021-2029 (USD Million)
- Market Size and Forecast by Clinical Application, 2021-2029 (USD Million)
- BrazilAdvanced Visualization Market
- Brazil Market Size and Forecast, 2021-2029 (USD Million)
- Market Size and Forecast by Modality, 2021-2029 (USD Million)
- Market Size and Forecast by Solution Type, 2021-2029 (USD Million)
- Market Size and Forecast by Modality, 2021-2029 (USD Million)
- Market Size and Forecast by Clinical Application, 2021-2029 (USD Million)
- MexicoAdvanced Visualization Market
- Mexico Market Size and Forecast, 2021-2029 (USD Million)
- Market Size and Forecast by Product & Services, 2021-2029 (USD Million)
- Market Size and Forecast by Solution Type, 2021-2029 (USD Million)
- Market Size and Forecast by Modality, 2021-2029 (USD Million)
- Market Size and Forecast by Clinical Application, 2021-2029 (USD Million)
- Argentina Advanced Visualization Market
- Argentina Market Size and Forecast, 2021-2029 (USD Million)
- Market Size and Forecast by Product & Services, 2021-2029 (USD Million)
- Market Size and Forecast by Solution Type, 2021-2029 (USD Million)
- Market Size and Forecast by Modality, 2021-2029 (USD Million)
- Market Size and Forecast by Clinical Application, 2021-2029 (USD Million)
- Rest of Latin America Advanced Visualization Market
- Rest of Latin America Market Size and Forecast, 2021-2029 (USD Million)
- Market Size and Forecast by Product & Services, 2021-2029 (USD Million)
- Market Size and Forecast by Solution Type, 2021-2029 (USD Million)
- Market Size and Forecast by Modality, 2021-2029 (USD Million)
- Market Size and Forecast by Clinical Application, 2021-2029 (USD Million)
- Rest of Latin America Market Size and Forecast, 2021-2029 (USD Million)
- Argentina Market Size and Forecast, 2021-2029 (USD Million)
- Mexico Market Size and Forecast, 2021-2029 (USD Million)
- Brazil Market Size and Forecast, 2021-2029 (USD Million)
- Latin America Market Size and Forecast, 2021-2029 (USD Million)
- Latin America Advanced Visualization Market
- MEAAdvanced Visualization Market
- MEA Advanced Visualization Market
- MEA Market Size and Forecast, 2021-2029 (USD Million)
- Market Size and Forecast by Product & Services, 2021-2029 (USD Million)
- Market Size and Forecast by Solution Type, 2021-2029 (USD Million)
- Market Size and Forecast by Modality, 2021-2029 (USD Million)
- Market Size and Forecast by Clinical Application, 2021-2029 (USD Million)
- GCC Advanced Visualization Market
- GCC Market Size and Forecast, 2021-2029 (USD Million)
- Market Size and Forecast by Product & Services, 2021-2029 (USD Million)
- Market Size and Forecast by Solution Type, 2021-2029 (USD Million)
- Market Size and Forecast by Modality, 2021-2029 (USD Million)
- Market Size and Forecast by Clinical Application, 2021-2029 (USD Million)
- South Africa Advanced Visualization Market
- South Africa Market Size and Forecast, 2021-2029 (USD Million)
- Market Size and Forecast by Product & Services, 2021-2029 (USD Million)
- Market Size and Forecast by Solution Type, 2021-2029 (USD Million)
- Market Size and Forecast by Modality, 2021-2029 (USD Million)
- Market Size and Forecast by Clinical Application, 2021-2029 (USD Million)
- Rest of MEA Advanced Visualization Market
- Rest of MEA Market Size and Forecast, 2021-2029 (USD Million)
- Market Size and Forecast by Product & Services, 2021-2029 (USD Million)
- Market Size and Forecast by Solution Type, 2021-2029 (USD Million)
- Market Size and Forecast by Modality, 2021-2029 (USD Million)
- Market Size and Forecast by Clinical Application, 2021-2029 (USD Million)
- Rest of MEA Market Size and Forecast, 2021-2029 (USD Million)
- South Africa Market Size and Forecast, 2021-2029 (USD Million)
- GCC Market Size and Forecast, 2021-2029 (USD Million)
- MEA Market Size and Forecast, 2021-2029 (USD Million)
- MEA Advanced Visualization Market
- Competitor Analysis
- Market Share Analysis, 2021 & 2029
- Competitive Mapping
- Key Players Market Place Analysis
- Major Recent Developments
- Company Profiles
- General Electric Company (U.S.)
- Company Snapshot
- Company Overview
- Financials
- Solution Type Benchmarking
- Recent Developments
- Siemens AG (Germany)
- Company Snapshot
- Company Overview
- Financials
- Solution Type Benchmarking
- Recent Developments
- Koninklijke Philips N.V. (Netherlands)
- Company Snapshot
- Company Overview
- Financials
- Solution Type Benchmarking
- Recent Developments
- Toshiba Corporation (Japan)
- Company Snapshot
- Company Overview
- Financials
- Solution Type Benchmarking
- Recent Developments
- Terarecon, Inc. (U.S.)
- Company Snapshot
- Company Overview
- Financials
- Solution Type Benchmarking
- Recent Developments
- Fujifilm Holdings Ltd. (Japan)
- Company Snapshot
- Company Overview
- Financials
- Solution Type Benchmarking
- Recent Developments
- SugarCRM (US)
- Company Snapshot
- Company Overview
- Financials
- Solution Type Benchmarking
- Recent Developments
- Accenture (Ireland)
- Company Snapshot
- Company Overview
- Financials
- Solution Type Benchmarking
- Recent Developments
- Healthgrades (US)
- Company Snapshot
- Company Overview
- Financials
- Solution Type Benchmarking
- Recent Developments
- Infor, Inc. (US)
- Company Snapshot
- Company Overview
- Financials
- Solution Type Benchmarking
- Recent Developments
- Company 11
- Company Snapshot
- Company Overview
- Financials
- Solution Type Benchmarking
- Recent Developments
- Company 12
- Company Snapshot
- Company Overview
- Financials
- Solution Type Benchmarking
- Recent Developments
- Company 13
- Company Snapshot
- Company Overview
- Financials
- Solution Type Benchmarking
- Recent Developments
- Company 14
- Company Snapshot
- Company Overview
- Financials
- Solution Type Benchmarking
- Recent Developments
- Company 15
- Company Snapshot
- Company Overview
- Financials
- Solution Type Benchmarking
- Recent Developments
- Others Prominent Players
- General Electric Company (U.S.)
- Conclusion & Recommendations


