
The global computed tomography market size is estimated to be USD 43.76 billion in 2021 and is expected to witness a CAGR of 7.98% during the forecast period. Rise in global geriatric population along with increase in cases of chronic diseases is a key driver for the growth of the global computed tomography market. Additionally, shift of health care infrastructure towards image-guided involvements in the market are some of the other drivers propelling the market growth. Nevertheless, high risk of health issues related to radiation exposure and lack of acceptable compensation are expected to restrain the global market growth.
Global Computed Tomography Market Size (USD Billion), 2021-2029
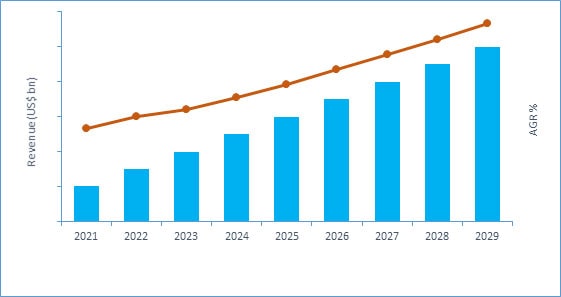
Source: Erevna Healthcare
By Technology
Based on technology, the market is segmented into cone beam technology, low end slice, mid end slice, and high-end slice. In 2021, the high- and mid-end slice segment accounted for a substantial revenue share and is expected to grow with a lucrative CAGR during the forecast period. This is attributed to use of high-end slices as they are able to deliver thorough images in obese patients along with the refining healthcare infrastructure and developing financing capability worldwide. The cone beam technology segment is projected to grow at a profitable CAGR during the forecast period. This is attributed to various advantages of using this technology such as its compact size, low cost, and low radiation exposure compared to conservative CT technology.
By Application
Based on application, the market is segmented into cardiology, oncology, vascular, neurology, musculoskeletal, and others. In 2021, the oncology segment accounted for a significant revenue share and is expected to grow with a lucrative CAGR during the forecast period. This can be attributed to the increase in incidence of cancer and growth in applications of CT scans in analysis of various types of cancers comprising of tumors and lumps worldwide. Neurology and musculoskeletal segment is anticipated to grow at a profitable CAGR during the forecast period. This is attributed to the growth in geriatric population, as they are more susceptible to diseases.
By End User
Based on end user, the market is categorized into ambulatory imaging center, hospitals, and diagnostics imaging center. In 2021, the hospitals segment accounted for a substantial revenue share and is expected to grow with a lucrative CAGR during the forecast period. This is due to the fact that CT scans serve as an operational tool for precise analysis pre-operative and post-operative to regulate the efficiency of the treatment worldwide. The ambulatory imaging center segment is anticipated to grow at a profitable CAGR during the forecast period, due to the increasing application of CT scans in these imaging centers.
Regional Insights
In 2021, North America held the highest revenue share in the global market and is expected to maintain its dominance during the forecast period. This is attributed to the increase in the aging population along with occurrence of chronic disorders, increase in the share of healthcare expenditure in the per capita income, growth in initiatives from the government, and accessibility of technologically advanced products in the region. Asia Pacific market is projected to exhibit the fastest CAGR over the forecast period owing to the growth in patient emphasis on operational and prompt disease diagnosis, growing government and corporate investment in healthcare sector, increasing travel tourism in the developing economies, and market growth opportunities in developing countries.
Competitor Insights
Some of the key players in the computed tomography market are Canon Medical Systems Corporation (Japan); Fujifilm Holdings Corporation (Japan); General Electric Company (U.S.); Hitachi, Ltd. (Japan); Koning Corporation (U.S.); Koninklijke Philips NV (Nertherlands); NeuroLogica Corp (U.S.); Neusoft Corporation (China); Siemens Healthineers AG (Germany); and Shenzhen Anke High-Tech Co. (China). The leading players operating in the computed tomography industry are adopting various strategies including R&D investments, adaption of advanced techniques, new technology launches, mergers & acquisitions, and regional expansions to capture a maximum revenue share.
This exhaustive research report focuses on market size and forecast at global, segmental, regional and country level along with key market trends and dynamics from 2021 to 2029. The computed tomography market report is categorized into the following segments and subsegments:
Computed Tomography Market, By Technology (Revenue, USD Billion, 2021 – 2029)
- Cone beam technology
- Low end slice
- Mid end slice
- High end slice
Computed Tomography Market, By Application (Revenue, USD Billion, 2021 – 2029)
- Cardiology
- Oncology
- Vascular
- Neurology
- Musculoskeletal
- Others
Computed Tomography Market, By End User (Revenue, USD Billion, 2021 – 2029)
- Ambulatory imaging center
- Hospitals
- Diagnostics imaging center
Computed Tomography Market, By Region (Revenue, USD Billion, 2021 – 2029)
- North America
- U.S.
- Canada
- Europe
- Germany
- France
- UK
- Spain
- Italy
- Russia
- Rest of Europe
- Asia Pacific
- China
- Japan
- India
- Australia
- South Korea
- Rest of APAC
- Latin America
- Brazil
- Mexico
- Argentina
- Rest of LATAM
- Middle East & Africa
- South Africa
- Saudi Arabia
- Rest of MEA
Scope of Computed Tomography Market Report:
| Key Parameters | Details |
|---|---|
| Base Year |
|
| Forecast Period |
|
| Study Coverage |
|
| Qualitative Analysis |
|
| Regional Market Scope |
|
| Company Profiles |
|
| 15% Free Customization Available |
|
Table of Contents: Computed Tomography Market 2021-2029
- Research Methodology
- Study Objectives
- Study Scope
- Research Assumptions
- Research Framework
- Research Models
- Bottom-up Approach
- Top-down Approach
- Data Triangulation
- Data Procurement
- Internal Database
- Secondary Research
- Purchased Database
- Primary Research
- Data Analysis
- Data Validation
- Market Size Estimation
- Market Forecast Model
- Quality Assessment
- Research Models
- Introduction: Computed Tomography
- Executive Summary
- Global Market Scenario
- Segment Market Scenario
- Geographic Market Scenario
- COVID-19 Impact
- Competitive Landscape
- Market Dynamics
- Market Drivers
- Driver 1
- Driver 2
- Driver 3
- Driver 4
- Driver 5
- Market Restraint
- Restraint 1
- Restraint 2
- Restraint 3
- Restraint 4
- Market Opportunities
- Opportunity 1
- Opportunity 2
- Opportunity 3
- Opportunity 4
- Market Trends
- Trend 1
- Trend 2
- Trend 3
- Trend 4
- Market Challenges
- Challenge 1
- Challenge 2
- Challenge 3
- Challenge 4
- Market Drivers
- Market Environment Analysis
- Porter’s 5 Forces Analysis
- PESTEL Analysis
- Value Chain Analysis
- SWOT Analysis
- Benchmark
- COVID-19 Impact Analysis: Computed Tomography Market
- COVID-19: Overview
- COVID-19 Impact on the Global Market
- COVID-19 Impact on the Regional Markets
- Market Analysis by Technology
- Cone beam technology
- Cone beam technology Market Forecast, 2021-2029 (USD Million)
- Low end slice
- Low end slice Market Forecast, 2021-2029 (USD Million)
- Mid end slice
- Mid end slice Market Forecast, 2021-2029 (USD Million)
- High end slice
- High end slice Market Forecast, 2021-2029 (USD Million)
- Cone beam technology
- Market Analysis by Application
- Cardiology
- Cardiology Market Forecast, 2021-2029 (USD Million)
- Oncology
- Oncology Market Forecast, 2021-2029 (USD Million)
- Vascular
- Vascular Market Forecast, 2021-2029 (USD Million)
- Neurology
- Neurology Market Forecast, 2021-2029 (USD Million)
- Musculoskeletal
- Musculoskeletal Market Forecast, 2021-2029 (USD Million)
- Others
- Others Market Forecast, 2021-2029 (USD Million)
- Cardiology
- Market Analysis by End User
- Ambulatory imaging center
- Ambulatory imaging center Market Forecast, 2021-2029 (USD Million)
- Hospitals
- Hospitals Market Forecast, 2021-2029 (USD Million)
- Diagnostics imaging center
- Diagnostics imaging center Market Forecast, 2021-2029 (USD Million)
- Ambulatory imaging center
- Regional Market Analysis
- Regional Market Trends
- Regional Market: Comparative Analysis
- North America Computed Tomography Market
- North America Computed Tomography Market
- North America Market Size and Forecast, 2021-2029 (USD Million)
- Market Size and Forecast by Technology, 2021-2029 (USD Million)
- Market Size and Forecast by Application, 2021-2029 (USD Million)
- Market Size and Forecast byEnd User, 2021-2029 (USD Million)
- S. Computed Tomography Market
- S. Market Size and Forecast, 2021-2029 (USD Million)
- Market Size and Forecast by Technology, 2021-2029 (USD Million)
- Market Size and Forecast by Application, 2021-2029 (USD Million)
- Market Size and Forecast byEnd User, 2021-2029 (USD Million)
- Canada Computed Tomography Market
- Canada Market Size and Forecast, 2021-2029 (USD Million)
- Market Size and Forecast by Technology, 2021-2029 (USD Million)
- Market Size and Forecast by Application, 2021-2029 (USD Million)
- Market Size and Forecast byEnd User, 2021-2029 (USD Million)
- Canada Market Size and Forecast, 2021-2029 (USD Million)
- S. Market Size and Forecast, 2021-2029 (USD Million)
- North America Market Size and Forecast, 2021-2029 (USD Million)
- North America Computed Tomography Market
- Europe Computed Tomography Market
- Europe Computed Tomography Market
- Europe Market Size and Forecast, 2021-2029 (USD Million)
- Market Size and Forecast by Technology, 2021-2029 (USD Million)
- Market Size and Forecast by Application, 2021-2029 (USD Million)
- Market Size and Forecast byEnd User, 2021-2029 (USD Million)
- Germany Computed Tomography Market
- Germany Market Size and Forecast, 2021-2029 (USD Million)
- Market Size and Forecast by Technology, 2021-2029 (USD Million)
- Market Size and Forecast by Application, 2021-2029 (USD Million)
- Market Size and Forecast byEnd User, 2021-2029 (USD Million)
- UK Computed Tomography Market
- UK Market Size and Forecast, 2021-2029 (USD Million)
- Market Size and Forecast by Technology, 2021-2029 (USD Million)
- Market Size and Forecast by Application, 2021-2029 (USD Million)
- Market Size and Forecast byEnd User, 2021-2029 (USD Million)
- France Computed Tomography Market
- France Market Size and Forecast, 2021-2029 (USD Million)
- Market Size and Forecast by Technology, 2021-2029 (USD Million)
- Market Size and Forecast by Application, 2021-2029 (USD Million)
- Market Size and Forecast byEnd User, 2021-2029 (USD Million)
- Spain Computed Tomography Market
- Spain Market Size and Forecast, 2021-2029 (USD Million)
- Market Size and Forecast by Technology, 2021-2029 (USD Million)
- Market Size and Forecast by Application, 2021-2029 (USD Million)
- Market Size and Forecast byEnd User, 2021-2029 (USD Million)
- Italy Computed Tomography Market
- Italy Market Size and Forecast, 2021-2029 (USD Million)
- Market Size and Forecast by Technology, 2021-2029 (USD Million)
- Market Size and Forecast by Application, 2021-2029 (USD Million)
- Market Size and Forecast byEnd User, 2021-2029 (USD Million)
- Rest of Europe Computed Tomography Market
- Rest of Europe Market Size and Forecast, 2021-2029 (USD Million)
- Market Size and Forecast by Technology, 2021-2029 (USD Million)
- Market Size and Forecast by Application, 2021-2029 (USD Million)
- Market Size and Forecast byEnd User, 2021-2029 (USD Million)
- Rest of Europe Market Size and Forecast, 2021-2029 (USD Million)
- Italy Market Size and Forecast, 2021-2029 (USD Million)
- Spain Market Size and Forecast, 2021-2029 (USD Million)
- France Market Size and Forecast, 2021-2029 (USD Million)
- UK Market Size and Forecast, 2021-2029 (USD Million)
- Germany Market Size and Forecast, 2021-2029 (USD Million)
- Europe Market Size and Forecast, 2021-2029 (USD Million)
- Europe Computed Tomography Market
- Asia Pacific Computed Tomography Market
- Asia Pacific Computed Tomography Market
- Asia Pacific Market Size and Forecast, 2021-2029 (USD Million)
- Market Size and Forecast by Technology, 2021-2029 (USD Million)
- Market Size and Forecast by Application, 2021-2029 (USD Million)
- Market Size and Forecast byEnd User, 2021-2029 (USD Million)
- Japan Computed Tomography Market
- Japan Market Size and Forecast, 2021-2029 (USD Million)
- Market Size and Forecast by Technology, 2021-2029 (USD Million)
- Market Size and Forecast by Application, 2021-2029 (USD Million)
- Market Size and Forecast byEnd User, 2021-2029 (USD Million)
- China Computed Tomography Market
- China Market Size and Forecast, 2021-2029 (USD Million)
- Market Size and Forecast by Technology, 2021-2029 (USD Million)
- Market Size and Forecast by Application, 2021-2029 (USD Million)
- Market Size and Forecast byEnd User, 2021-2029 (USD Million)
- India Computed Tomography Market
- India Market Size and Forecast, 2021-2029 (USD Million)
- Market Size and Forecast by Technology, 2021-2029 (USD Million)
- Market Size and Forecast by Application, 2021-2029 (USD Million)
- Market Size and Forecast byEnd User, 2021-2029 (USD Million)
- South Korea Computed Tomography Market
- South Korea Market Size and Forecast, 2021-2029 (USD Million)
- Market Size and Forecast by Technology, 2021-2029 (USD Million)
- Market Size and Forecast by Application, 2021-2029 (USD Million)
- Market Size and Forecast byEnd User, 2021-2029 (USD Million)
- Australia Computed Tomography Market
- Australia Market Size and Forecast, 2021-2029 (USD Million)
- Market Size and Forecast by Technology, 2021-2029 (USD Million)
- Market Size and Forecast by Application, 2021-2029 (USD Million)
- Market Size and Forecast byEnd User, 2021-2029 (USD Million)
- Rest of Asia Pacific Computed Tomography Market
- Rest of Asia Pacific Market Size and Forecast, 2021-2029 (USD Million)
- Market Size and Forecast by Technology, 2021-2029 (USD Million)
- Market Size and Forecast by Application, 2021-2029 (USD Million)
- Market Size and Forecast byEnd User, 2021-2029 (USD Million)
- Rest of Asia Pacific Market Size and Forecast, 2021-2029 (USD Million)
- Australia Market Size and Forecast, 2021-2029 (USD Million)
- South Korea Market Size and Forecast, 2021-2029 (USD Million)
- India Market Size and Forecast, 2021-2029 (USD Million)
- China Market Size and Forecast, 2021-2029 (USD Million)
- Japan Market Size and Forecast, 2021-2029 (USD Million)
- Asia Pacific Market Size and Forecast, 2021-2029 (USD Million)
- Asia Pacific Computed Tomography Market
- Latin America Computed Tomography Market
- Latin America Computed Tomography Market
- Latin America Market Size and Forecast, 2021-2029 (USD Million)
- Market Size and Forecast by Technology, 2021-2029 (USD Million)
- Market Size and Forecast by Application, 2021-2029 (USD Million)
- Market Size and Forecast byEnd User, 2021-2029 (USD Million)
- Brazil Computed Tomography Market
- Brazil Market Size and Forecast, 2021-2029 (USD Million)
- Market Size and Forecast by Technology, 2021-2029 (USD Million)
- Market Size and Forecast by Application, 2021-2029 (USD Million)
- Market Size and Forecast byEnd User, 2021-2029 (USD Million)
- Mexico Computed Tomography Market
- Mexico Market Size and Forecast, 2021-2029 (USD Million)
- Market Size and Forecast by Technology, 2021-2029 (USD Million)
- Market Size and Forecast by Application, 2021-2029 (USD Million)
- Market Size and Forecast byEnd User, 2021-2029 (USD Million)
- Argentina Computed Tomography Market
- Argentina Market Size and Forecast, 2021-2029 (USD Million)
- Market Size and Forecast by Technology, 2021-2029 (USD Million)
- Market Size and Forecast by Application, 2021-2029 (USD Million)
- Market Size and Forecast byEnd User, 2021-2029 (USD Million)
- Rest of Latin America Computed Tomography Market
- Rest of Latin America Market Size and Forecast, 2021-2029 (USD Million)
- Market Size and Forecast by Technology, 2021-2029 (USD Million)
- Market Size and Forecast by Application, 2021-2029 (USD Million)
- Market Size and Forecast byEnd User, 2021-2029 (USD Million)
- Rest of Latin America Market Size and Forecast, 2021-2029 (USD Million)
- Argentina Market Size and Forecast, 2021-2029 (USD Million)
- Mexico Market Size and Forecast, 2021-2029 (USD Million)
- Brazil Market Size and Forecast, 2021-2029 (USD Million)
- Latin America Market Size and Forecast, 2021-2029 (USD Million)
- Latin America Computed Tomography Market
- MEA Computed Tomography Market
- MEA Computed Tomography Market
- MEA Market Size and Forecast, 2021-2029 (USD Million)
- Market Size and Forecast by Technology, 2021-2029 (USD Million)
- Market Size and Forecast by Application, 2021-2029 (USD Million)
- Market Size and Forecast byEnd User, 2021-2029 (USD Million)
- GCC Computed Tomography Market
- GCC Market Size and Forecast, 2021-2029 (USD Million)
- Market Size and Forecast by Technology, 2021-2029 (USD Million)
- Market Size and Forecast by Application, 2021-2029 (USD Million)
- Market Size and Forecast byEnd User, 2021-2029 (USD Million)
- South Africa Computed Tomography Market
- South Africa Market Size and Forecast, 2021-2029 (USD Million)
- Market Size and Forecast by Technology, 2021-2029 (USD Million)
- Market Size and Forecast by Application, 2021-2029 (USD Million)
- Market Size and Forecast byEnd User, 2021-2029 (USD Million)
- Rest of MEA Computed Tomography Market
- Rest of MEA Market Size and Forecast, 2021-2029 (USD Million)
- Market Size and Forecast by Technology, 2021-2029 (USD Million)
- Market Size and Forecast by Application, 2021-2029 (USD Million)
- Market Size and Forecast byEnd User, 2021-2029 (USD Million)
- Rest of MEA Market Size and Forecast, 2021-2029 (USD Million)
- South Africa Market Size and Forecast, 2021-2029 (USD Million)
- GCC Market Size and Forecast, 2021-2029 (USD Million)
- MEA Market Size and Forecast, 2021-2029 (USD Million)
- MEA Computed Tomography Market
- Competitor Analysis
- Market Share Analysis, 2021 & 2029
- Competitive Mapping
- Key Players Market Place Analysis
- Major Recent Developments
- Company Profiles
- Canon Medical Systems Corporation (Japan)
- Company Snapshot
- Company Overview
- Financials
- Application Benchmarking
- Recent Developments
- Fujifilm Holdings Corporation (Japan)
- Company Snapshot
- Company Overview
- Financials
- Application Benchmarking
- Recent Developments
- General Electric Company (U.S.)
- Company Snapshot
- Company Overview
- Financials
- Application Benchmarking
- Recent Developments
- Hitachi, Ltd. (Japan)
- Company Snapshot
- Company Overview
- Financials
- Application Benchmarking
- Recent Developments
- Koning Corporation (U.S.)
- Company Snapshot
- Company Overview
- Financials
- Application Benchmarking
- Recent Developments
- Koninklijke Philips NV (Nertherlands)
- Company Snapshot
- Company Overview
- Financials
- Application Benchmarking
- Recent Developments
- NeuroLogica Corp (U.S.)
- Company Snapshot
- Company Overview
- Financials
- Application Benchmarking
- Recent Developments
- Neusoft Corporation (China)
- Company Snapshot
- Company Overview
- Financials
- Application Benchmarking
- Recent Developments
- Siemens Healthineers AG (Germany)
- Company Snapshot
- Company Overview
- Financials
- Application Benchmarking
- Recent Developments
- Shenzhen Anke High-Tech Co. (China)
- Company Snapshot
- Company Overview
- Financials
- Application Benchmarking
- Recent Developments
- Holografika Kft. (Hungary)
- Company Snapshot
- Company Overview
- Financials
- Technology Benchmarking
- Recent Developments
- Company 12
- Company Snapshot
- Company Overview
- Financials
- Technology Benchmarking
- Recent Developments
- Company 13
- Company Snapshot
- Company Overview
- Financials
- Technology Benchmarking
- Recent Developments
- Company 14
- Company Snapshot
- Company Overview
- Financials
- Technology Benchmarking
- Recent Developments
- Company 15
- Company Snapshot
- Company Overview
- Financials
- Technology Benchmarking
- Recent Developments
- Others Prominent Players
- Canon Medical Systems Corporation (Japan)
Conclusion & Recommendations


